Wednesday, January 4, 2012

Running Artifactory with Tomcat behind Apache HTTPD

At work we're setting up some new Artifactory instances in the AWS cloud, using all the latest gizmos - Ubuntu 11, Java 7, a dedicated Tomcat instance as the Web container and MySQL as the data store. We wanted to run Tomcat behind Apache HTTPD as the default application; this took a few tries before we got it right, so I'm posting the details here as I didn't find many results when Googling.

The following assumes you're using a dedicated Tomcat instance to run Artifactory and that you've used their $ARTIFACTORY_HOME/bin/tomcat-install.sh script to do a standard installation, so that Artifactory is listening on http://yourhost.yourdomain:8081/artifactory, with an AJP listener on port 8019.

Install mod_proxy_ajp:

sudo a2enmod proxy_ajp

Set up the Apache site configuration to proxy requests to Artifactory - default config file under Ubuntu is /etc/apache2/sites-enabled/000-default

ProxyPreserveHost on
ProxyPass / ajp://localhost:8019/artifactory/
ProxyPassReverse / http://yourhost.yourdomain/artifactory
ProxyPassReverseCookiePath /artifactory/ /

Add these lines just before the end of the VirtualHost section.

Restart Apache:

sudo service apache2 restart

Now Artifactory should respond on http://yourhost.yourdomain

Finally, go to the Admin tab in Artifactory, select General in the left toolbar and set the Custom URL Base field to http://yourhost.yourdomain

Tuesday, May 10, 2011

Testing, 1-2-3

There's a new kid on the block for QA / testing question and answer sites - the SQA Stack Exchange, brought to you by the good folks behind Stack Overflow and Server Fault among others.

I hope this one gets more traction than the older testing.stackexchange site, which never got the volume of users and questions to take off. Testing questions tend to have less well-defined answers than programming ones, but there's already a good chunk of useful knowledge and opinions on the SQA Stack Exchange. Check it out and ask / answer some questions, you'll feel better !

Friday, October 8, 2010

Morning, Campers

I'm heading to the Atlassian AtlasCamp next week with three other guys from work; it should be two and a half days of fun and intensity (plus seafood and beer ;-)), learning how to extend JIRA / Fisheye / Crucible and meeting lots of developers from Atlassian and external plugin companies. I'll report back on how it goes in another post.

We're trying to extend JIRA in quite a few ways at work, so I'm hoping to find answers to a few things (and ideally apply the "lazy engineer" principle of stealing code that someone has already written rather than doing it myself !). The main ones at this point are:
  • Using JIRA for test case management (TCM)
  • Getting build analytics out of JIRA, Fisheye and Perforce that will show all the changes that went into a release, without having to drill down into individual JIRA issues

Thursday, July 29, 2010

Migrating a Hudson instance

Quick post to hopefully help others with an error I got when moving our Hudson instance from Windows to its new home on a Linux server.

The basic migration is super easy - just zip up the Hudson home directory (default on Windows XP is C:\Documents and Settings\[username running Hudson]\.hudson) and restore it onto the new server. However, when you start your new Hudson instance you may see one of both of the following errors in the console output:

SEVERE: Timer task hudson.model.LoadStatistics$LoadStatisticsUpdater@74e8f8c5 failed
java.lang.AssertionError: class hudson.node_monitors.DiskSpaceMonitor is missing its descriptor
at hudson.model.Hudson.getDescriptorOrDie(Hudson.java:937)
at hudson.node_monitors.NodeMonitor.getDescriptor(NodeMonitor.java:83)
at hudson.node_monitors.NodeMonitor.getDescriptor(NodeMonitor.java:67)
at hudson.util.DescribableList.get(DescribableList.java:104)
at hudson.model.ComputerSet.(ComputerSet.java:356)
at hudson.model.LoadStatistics$LoadStatisticsUpdater.doRun(LoadStatistics.java:214)
at hudson.triggers.SafeTimerTask.run(SafeTimerTask.java:54)
at java.util.TimerThread.mainLoop(Timer.java:512)
at java.util.TimerThread.run(Timer.java:462)

Jul 29, 2010 1:47:39 PM hudson.triggers.SafeTimerTask run
SEVERE: Timer task hudson.model.LoadStatistics$LoadStatisticsUpdater@74e8f8c5 failed
java.lang.NoClassDefFoundError
at hudson.model.LoadStatistics$LoadStatisticsUpdater.doRun(LoadStatistics.java:214)
at hudson.triggers.SafeTimerTask.run(SafeTimerTask.java:54)
at java.util.TimerThread.mainLoop(Timer.java:512)
at java.util.TimerThread.run(Timer.java:462)

The fix is easy - just stop Hudson, delete the file nodeMonitors.xml in the main Hudson directory, and restart Hudson. It looks as if that file contains data that's specific to the old system; Hudson will recreate the file after restart.

Wednesday, July 7, 2010

Hudson as a CVS Watcher on Windows


I'm currently consulting at a large corporate outfit in Silicon Valley - sometimes it's a bit like going back in time to the mid-90s. They're using CVS and most developers don't have much visibility into the repository, so one of the first things I set up was an email to interested people every time somebody checks into CVS.

Hudson was the perfect choice for this since I want to move on to continuous build, test and deployment eventually, but it doesn't hurt to start with a baby step. The surprise on the faces of people who haven't come across Hudson or CI tools in general is something to behold !

I had to run Hudson on a Windows machine, which came with its own little set of issues, so here's a step by step for future reference.
  1. Install a Windows CVS command line client. This proved a little hard to track down as the main cvsnt.org site doesn't seem to have any free downloads any more. I eventually found the CVSNT client bundled with the CvsGui project at http://www.wincvs.org/ - it comes with a separate installer, cvsnt_steup.exe, that lets you install just the client utilities.
  2. Install and run Hudson - just get the WAR file from the download page, save it locally and run "java -jar hudson.war"
  3. Set up Hudson as a Windows service - in typical easy-to-use Hudson fashion, you do this from within Hudson itself by going to the "Manage Hudson" page and selecting "Install as Windows service".
  4. Make sure that the Hudson service will run as a user that's already set up to access the CVS repository - for example, if your repository access is via extssh, you'll need to make sure that the user already has the SSH host connection info saved locally, so that you don't get prompts about saving the connection info when Hudson tries to do a CVS update. On Windows XP (yep, my corporate paymaster is still on XP), right-click My Computer in the Start menu, click Manage, then Services under Services and Applications. Right click the Hudson service, select Properties, then enter the user name and Windows password in the Log On tab.
  5. Restart your machine - I found that this was the only reliable way to get Hudson to come back up after making changes in steps 3 and 4.
You should now be good to go and set up your Hudson jobs to poll the CVS repository and report any changes via email; Hudson should be running at http://localhost:8080 by default.

For extra email configurability I used the email-ext plugin; this lets you send email for all successful builds (not just failures and fixes like the default Hudson behaviour) and include all kinds of info in the email body, such as a list of file changes in configurable format.

More to follow as I set up the build and test stuff; we have a client written in Adobe flex talking to a SOAP API with Tibco on the back end, so there should be some, ahem, interesting challenges there ....

Friday, June 18, 2010

Location Irrelevance

Warning: this is a bit more political than my usual tech-heavy posts.

I was leafing through James Bach's blog the other day; James is one of today's leading writers about software testing and always well worth a read. He referred to an excellent post by Pradeep Soundararajan, one of my other favourite testing thinkers and writers, which really nailed some important test patterns that I've come across the need for frequently, but never figured out how to summarize. I highly recommend that you read Pradeep's post before you carry on.

At the end of his post, James referred to Pradeep as "one of the leading Indian testers". This made me feel a bit uncomfortable, enough so to comment on the post, and James commented back:

"I think culture is relevant, and nationality often associates to culture. There is a distinctive Indian testing sub-culture. I also think there is an American testing culture, too. I wouldn't mind being called an American tester."

I can't agree with that at all. Software testing expertise shouldn't be about culture, location or nationality at all, unless you're in the really specialized test areas of localization or internationalization. Given the frequently negative connotation that badly-handled outsourcing projects have given to software professionals outside of North America and Western Europe, I think it does no good at all to classify anyone by nationality or location - or sex, musical taste, number of prehensile toes, or anything else other than ability - when discussing their professional achievements.

One of the great things about the internet is that it's levelled the global playing field for writing, testing and using computer software to a massive extent. Let's keep it that way, recognize the achievements of software professionals all over the world for what they are, and call a leading tester a leading tester, without confining them to some largely meaningless subcategory.

Thursday, June 10, 2010

The Tech Ops Nazi

I attended the excellent Atlassian Starter Day on Wednesday; it was a great session with many highlights (including a surprise appearance by Tom Cruise !) and worthy of multiple posts.

With DevOps Days USA fast approaching (I'm on one of the panels), it was interesting to hear multiple speakers at Starter Day talk about devops concepts. One of the highlights for me was Jochen Frey, Scout Labs' CTO, talking about how to run an effective startup engineering team (and how to mess it up). He seemed pretty sleep-deprived, citing Scout Labs' recent acquisition by Lithium Technologies as the reason, but got one of the biggest rounds of applause of the day for soldiering through to the end.

Jochen especially got my attention when he described the importance of having a "tech ops nazi" on your team. This is a kind of QA / program manager / IT ops hybrid person who essentially acts (alone or with their team) as a buffer between the developers and the deployed code, checking multiple criteria before new code is deployed:
  • the code builds successfully
  • all the expected changes are included in each build
  • all the tests pass on the deployment platform
  • the deployment configuration is standardized
A lot of this can and should be automated - see Eric Ries' excellent "Continuous Deployment in 5 Easy Steps" for some ideas here - but there's no substitute for a human with one foot in development and the other in deployment to deal with the edge cases that always come up.

I've been doing this kind of role myself for the last few years and really enjoy it, so it was nice to get some validation. That said, I'd rather think of myself as a devops enabler than a tech ops nazi !

Friday, April 2, 2010

EC2 Marks the Spot

I've been using Amazon EC2 at work and for personal projects for about three years now. It's got to the stage where I can't remember how we used to manage without being able to spin up a test or development machine on demand.

One downside of EC2 compared to other hosting options is the price. The cheapest on-demand Linux instance costs 8.5 cents per hour, which works out to just over $60 a month - a bit expensive if you just want to run something like a web server and don't need full sytem access. However, Amazon just came up with a way to cut this cost significantly by introducing Spot Instances.

You can read all the details by following the link, but the basic idea is that you bid on spare EC2 capacity by specifying the maximum price per hour that you're prepared to pay. If the current spot price (which varies continually based on supply and demand) is less than your bid, Amazon will start up your instance and keep it running until the spot price becomes higher than your bid. At that point your instance will be terminated.

The surprising thing I found after monitoring the small Linux instance spot price for a few days is that it's a LOT less than the on-demand price - it's stayed between 2.9c and 3.1c per hour. That means that if you bid, say, 5 cents per hour for your spot instance, you'll be pretty certain of getting a cheap, long-running instance unless there is a sudden spike in demand and the spot price goes over 5c / hour.

The only down side I've found so far, apart from the necessity to be prepared for the instance shutting down without warning (which you ought to do for all EC2 instances anyway) is that you seem to have to wait a while longer for your instance to be started up; the ones I tried took one or two hours, rather than the usual 15 minutes or so.

As a way to warn me if the EC2 spot price is getting close to my bid price, I wrote a Nagios plugin, check_ec2_spot_price, that will send me a warning if the spot price goes above a specified value. You can download it from the Nagios Exchange.


I'm also working on a Munin plugin that will graph the EC2 spot price over time; I'll post that here too when it's ready.

Friday, March 12, 2010

Expanding a Wireless Network: hooking up a Linksys WRE54G expander to a Netgear DG834G router

This isn't quite my usual kind of post, but it caused me so much hassle (mostly due to the sad state of the Linksys documentation) that I wanted to post the steps in the hope that it'll help others.

We were getting dead spots in our home wirelesss network (chiefly the sofa where we like to watch streaming movies on the laptop), so I bought a Linksys WRE54G expander for downstairs. This is an actual access point that connects to and extends a wireless network, as opposed to a booster antenna that you plug into your wireless router (note that not all wireless routers can take an external antenna).

In theory, hooking this up to our Netgear DG834G, which is a combined DSL moden and wireless router, should be pretty simple; you just get the WRE54G to join the wired network so that you can configure it with the access credentials for the wireless network, then plug it into an outlet in the area where you want to expand your wireless coverage. The difficulty came when the WRE54G documentation didn't explain anything about how to connect it if it can't join the existing wireless network right away without any configuration.

Barra's post on the Linksys forum was a big help here. These are the steps I took:
  1. Reset the expander for about 1 minute.
  2. Get the MAC address from the bottom of the WRE54G and add it to your router's DHCP setup so that the expander gets the IP address 192.168.0.240 (the third number of the IP address depends on your network's existing IP range; Linksys defaults to 192.168.1.x while Netgear uses 192.168.0.x)
  3. Connect the Ethernet cable that comes with the WRE54G to the expander and the other end to the ethernet port on a computer with a working display.
  4. Manually set the TCP/IP properties on the computer to: IP 192.168.0.111; subnet mask 255.255.255.0; Gateway 192.168.0.240 (the third number of the IP address depends on your network's existing IP range as above)
  5. Open a browser on the computer and type 192.168.0.240 (the IP address you gave to the expander)
  6. Leave the user name blank and type password "admin" to log on to the expander.
  7. Set wireless channel, SSID and security the same as on the router; set mode to Mixed.
  8. Set subnet mask to 255.255.255.0 and gateway to 192.168.0.1 (the IP address of the router)
  9. Save all changes in the expander setup.
  10. After making all changes, reset your PC to use DHCP and plug it back into the router if necessary.
  11. Go to the DG834G's management web page and, under Advanced Wireless Settings, check the box for Enable Wireless Bridging and Repeating, select the Repeater with Wireless Client Association radio button, and enter the MAC address of the expander under Remote MAC Address 1. (Thanks to Ben Carpenter for this step).
  12. Save the router changes.
  13. Locate the WRE-54G in an outlet somewhere near the router to begin with. You should see both lights on the expander turn blue, and you should be able to see the WRE54G in thel ist of attached devices on your router's management page. You should also be able to get to the expander's setup page from any computer on your network, at http://192.168.0.240
  14. If that all works, you should be good to unplug the expander and relocate it where you want to expand the wireless coverage.
The WRE54G is working really nicely for us now - but what a kerfuffle to set it up !

Friday, February 19, 2010

Build, Please, Mr. Hudson

One of the absolute must-have tools for any development team these day is a continuous integration (CI) system. Having all your team's code changes built and tested automatically as soon as they're checked into source control is a huge time saver and confidence builder; I shudder when I think of the old days when even small development teams needed one or more full-time build engineers maintaining a build process that took all night to run and often didn't run any tests.

Having got very familiar in previous jobs with CruiseControl, the still-sprightly granddaddy of CI tools, I've been having a bit of a love-hate relationship with Hudson, which my current team uses and which seems to be coming up as the standard for CI these days, especially on Java projects. Lately I've been feeling the love a lot more though, for two particular reasons that I'll go into more detail on here.

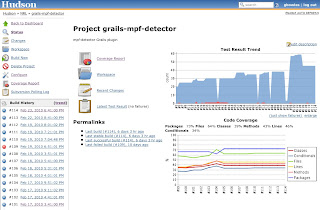
The first one is how easy it is to set up Hudson to build, test and report on Grails projects, which we're using as our standard for web app development these days. There's a nice post here that lays out all the details, but suffice to say that, thanks to Grails' and Hudsons' plugin architectures, it's very straightforward to set up a Hudson build that builds a Grails app, runs all its tests (including functional tests that run the complete app in its web container), collects code coverage statistics for the test run, and displays both the current test and coverage results plus trend graphs in the Hudson UI. Seeing the number of passing tests and the code coverage going up over time is a great motivator for developers !


The second thing that increased my admiration for Hudson is the ease of setting up a "slave" build server. You may want to do this to distribute multiple build jobs in order to maximize your resources, or to build on a specific platform. In my case I had the latter requirement; our Hudson server runs on CentOS but I needed to build a runtime distribution on SuSE 10.2.

The Hudson documentation on setting up a slave server isn't too great (the so-called step by step guide leads you to a blank page !), so I thought I'd lay out the steps I used here.
  1. Go to the Manage Hudson link in your Hudson dashboard and click Manage Nodes.
  2. Create a new node, name it and select the "Dumb Node" option (this actually seemed to be the only available option in my version of Hudson).
  3. Before you fill out the node details, verify a couple of things on the slave server. You need a directory that's writable by the user that will be running the Hudson slave process (this directory is where Hudson will check out the source code and run the build), and you need to copy the master Hudson server's public SSH key into ~/.ssh/authorized_keys for the Hudson slave process user on the slave server, so that Hudson can log in via SSH without a password.
  4. Fill out the node details. Specify the directory you created in step 3 for "remote FS root".
  5. Select "Launch agent via execution of command on the Master" for the launch method, and enter the command: ssh [Hudson slave user]@[slave host] "java -jar [remote FS root]/slave.jar"
  6. Set up the node properties (environment variables and tool locations) as needed. THIS IS IMPORTANT - because Hudson slaves have to be launched from the master, whereafter they're controlled via stdin and stdout on the slave process, you can't set environment variables like JAVA_HOME and ANT_HOME on the slave server via the slave user's environment. These variables need to be set up in the Hudson master's configuration, either via key-value pairs in the Environment settings for the node or, if you want to share values across nodes, in the Tool Locations settings (which are stored centrally and can also be maintained via Manage Hudson / System Settings).
  7. Save your new node. If all went well you should see it start up in the Manage Nodes page; if not, you should be able to figure out what went wrong from the Hudson log.
Once your slave node is set up, you can specify that it should be used for a given build job by checking "Tie this project to a node" and selecting the node in the job configuration. The slave builds will be controlled, logged and reported in the Hudson master UI just as if they were running on the master node - very nice !

UPDATE: this blog post by RMP adds a few details to my steps and also has a Linux startup script for the Hudson slave agent.

The slave build I set up is being used to build a set of C libraries, run tests on them and package them into a Linux RPM. This is a bit more tricky than building a Java based application, but there are some nice tricks we came up with to streamline the process into Hudson that I'll plan to blog on in a future post.

Friday, January 15, 2010

Fun with Nagios, part 2: Check Yer Backups

Being the second in a series of occasional posts on neat things you can do with your Nagios monitor that you might not have thought about.

I've been bitten by missing backups too often over the years, to the extent that I don't really feel secure unless I've got copies of each important system in at least three places. That leads to a lot of backup files, so wouldn't it be handy to have a process that checks whether your backup files are up to date and sends you a loud warning if not ?

Enter the trusty Nagios once again, in the guise of the check_file_age plugin. This plugin lets you check not only whether a file has been updated recently, but also that it has a minimum size; this way you can make sure that your backup put a new file in the right place and wrote something useful to the file.

Here's an example nrpe.cfg entry that runs on our backup server and checks the backup file from our JIRA server:

command[check_backup_jira]=/usr/local/nagios/libexec/check_file_age -c 86400 -w 86400 -C 500000 -W 500000 -f /NAS/Backups/eng-infrastructure-server/jira/`date +"%Y-%b-%d"`*.zip

The JIRA backup files are named for the date, so this command makes sure that a file named like "2010-Jan-15-*.zip" exists, the file is no older than 24 hours (86400 seconds) and is at least 500kb in size.

Et voila - now I have a sanity check that the backup process has run, has put the backup file in the right place, and that the file contains something.

The next step I'm working on is to check that each backup will actually restore to something useful - after all, as this Joel on Software article attests, backups are all well and good, but not much use if you can't get back what you need from them.

That's a subject for a future post, but I'm thinking that it should be straightforward, at least for our web apps like JIRA and Confluence. I should be able to restore the backup to a standby version of the web app running on a different machine and have a Nagios check_http or WebInject test verify that the content has been updated. I'd also get the benefit of being able to switch over to the standby with minimal downtime; looking forward to trying this out !

Entropy at Work

Like anyone who studied physics at school or college I knew the concept of entropy, but I only found out this week that Linux systems have their own version of the phenomenon.

I was setting up an RPM repository and wanted to create a GPG key for signing the repository files. Near the end of the key setup, I got this message:

Not enough random bytes available. Please do some other work to give
the OS a chance to collect more entropy! (Need 276 more bytes)

Entropy, eh ? Well, according to the physics I remember, the entropy of the universe is continually increasing; however; it turns out that a Linux system doesn't classify as its own universe and its entropy can go up and down, as evidenced by:

watch cat /proc/sys/kernel/random/entropy_avail

I could see the entropy value merrily going up and down between near zero and a couple of thousand, seemingly at random. After watching in fascination for a while, I developed the theory that the universe must comprise all of the Linux machines anywhere, merrily swapping their entropy bytes in some vast, complex dance which mere mortals cannot contemplate.

Turns out that the reality is a bit more down to earth; Linux calculates entropy by transforming interrupt events - activity from input devices such as the keyboard and mouse, or file system activity.

If you're in front of your system you can just point on the keyboard to generate enough entropy bytes to make your GPG key, but I happened to be working on an Amazon EC2 instance that I was logged into remotely. I managed to get enough randomness in the end by downloading a few large files from external web sites, and running "ls -R /" a couple of times to run through the entire root file system. Even though the entropy_avail value kept going up and down while I was doing this, it turned out that the GPG key generation just kept taking what was available as new bytes, and after 10 minutes or so had enough bytes to finish:

++++++++++.++++++++++>+++++...............>+++++............<.+++++....>.+
++++<.+++++>.+++++..................+++++^^^^^^^^^

gpg: key 2BC5527E marked as ultimately trusted
public and secret key created and signed.

Hopefully this post will help you to avoid one of those "WTF" moments; thanks to Carson Reynolds for providing most of the source material.

Monday, December 28, 2009

Fun with Nagios, part 1: timeliness of web content

I mentioned in an earlier post that I'm a big fan of the Nagios open source monitoring system. With very little work (on Linux, a couple of package installs and a bit of service configuration should do the trick) you can have a system up and running that will check all your servers for availability, disk space, memory and CPU usage and alert you when any resources exceed their limits.

It's pretty easy to add additional Nagios checks that will monitor all kinds of other useful things. I'll be making a few posts this week on that subject; today's deals with checking that your web site content is up to date.

One of my company's products is a web service that provides a speech-to-text transcription of news videos. The service pulls in videos from RSS feeds provided by the news source, runs the speech-to-text analysis and posts the results in another RSS feed (one per news source). As well as making sure that the output RSS feed is available 24x7, I wanted to check that new articles are being added each day. There are about 75 different news sources and thus output RSS feeds to check, so automation was pretty much mandatory.

This turned out to be a breeze, using Nagios' trusty check_http command and making use of the fact that you can pass the results of a command execution as a parameter to check_http. It's standard for each article in an RSS feed to have an attribute containing the publishing date; in my case this looks like:


Mon, 28 Dec 2009 23:40:04 GMT


To check that this feed has at least one article published today, here's the custom command from the RSS feed server's Nagios configuration file:

check_command check_http! -u /feeds/1010 -s "`date +\"%d %b %Y\"`"

This uses the standard -s parameter to check for a string in the HTTP response from the URL http://feedserver.mydomain.com/feeds/1010 but makes the string to be checked the output of the "date" command in the format used by the output RSS feed, e.g. "28 Dec 2009" in my case.

It was easy to add checks for the rest of the output feeds (which all have the same date format) by creating additional checks and just varying the feed URL.

The only other thing to watch here is that Nagios runs all its checks 24x7 by default, but the first new article of the day might not be published until some time well after midnight. To avoid getting "out of date content" alerts as soon as the date changes , you can set up a custom time period in the Nagios server's timeperiods.cfg file, e.g.

define timeperiod{
timeperiod_name news-content
alias Times when content from today should be present
sunday 8:00-24:00
monday 3:00-24:00
tuesday 3:00-24:00
wednesday 3:00-24:00
thursday 3:00-24:00
friday 3:00-24:00
saturday 8:00-24:00
}

This says that at least one article from today should be present at all times after 3am on weekdays and after 8am on weekends - we learned by experience that weekends are slower news days. Use the custom time period in the configuration entry for your date check:

define service{
use generic-service
host_name feedserver
check_period news-content
service_description Content updated: feed 1010
check_command check_http! -u /feeds/1010 -s "`date +\"%d %b %Y\"`"
}

and you're good to go.

More on useful Nagios checks later in the week; I'd love to hear your own favourite ones in the comments.

Tuesday, December 8, 2009

Exchanging Answers

I'm a regular user of the programming Q&A site stackoverflow.com and its companion for sysadmins, serverfault.com. Both sites have saved me a lot of time digging around the wilds of the web for answers, so I've tried to give back by answering questions whenever I can.

There are a few reasons why I like these sites: the flat organization of the questions and answers makes it really easy to narrow down the things you're looking for; the email and RSS notifications of new questions and answers are highly configurable; and - an unexpectedly good incentive for me - you can build up reputation points for asking good questions and giving good answers (as voted on by the other users of the sites).

There's now a similar Q&A site for software testers at http://testing.stackexchange.com - if Server Fault is Stack Overflow with a beard, ponytail and sandals, Testing.Stackexchange might be SO with half moon glasses and a clipboard. I think this could be a great forum to concentrate testing information; there's a lot of test related stuff on Stack Overflow already, but it's often buried with more development-oriented content. I'll be hanging out there regularly from now on.

Friday, November 13, 2009

The USB Breathalyzer

Here's some Friday fun - ever wanted to stop your sysadmins from logging in drunk and doing an "rm -rf /" on the production servers, or prevent your developers from checking in code that was written under the influence ? You need a USB breathalyzer !

This thread on serverfault.com has some other interesting ideas for preventing GUI (Geeking Under the Influence).

Monday, November 9, 2009

Advance your career over lunch

One of the online forums I frequent had a question today about what web resources engineers can use to advance their careers. Now don't get me wrong, learning from the web is all well and good. However, you'll learn far more in a given time from interacting with people than with a web page, simply because you can have a two-way conversation. Just about every time I've asked a friend or coworker for technical help, I've come away with information that I'd never thought to ask for directly.

Here's some ways you can work on your career advancement and learn at the same time:
  • Take every opportunity to learn from people with experience that you'd like to have - while being respectful of their time, of course. Even the busiest people are generally flattered to be asked and happy to talk about what they're working on; sharing coffee, lunch or beer with them doesn't hurt either !
  • Talk to everyone in your organization who you either work with directly, or whose job interests you. For example, you might want to move on from testing into development, operations, project management or many other related fields.
  • Attend conferences to meet up with your peers. Getting the budget to attend can be hard these days, but there are plenty of free opportunities around; have a look for local events at http://www.meetup.com/, for example. If you feel up to it, presenting at a conference or meetup is a great way to expand your network and gain valuable presenting experience.
Last but not least, the more people you engage with, the more you'll be giving an impression of yourself as someone who already has a particular set of skills, but is also smart and eager to learn. That certainly won't hurt your career development !

Neat trick for getting relative dates in a Linux shell script

I wanted to get the SVN updates done in the last 24 hours for a nightly script that updates and restarts one of our applications. The command would look something like:

svn log -v -r {#Calculate yesterday's date somehow }:{#Calculate today's date in yyyy-mm-dd format}

Getting today's date is easy enough using the "+" parameter with a format string, but yesterday's date seemed more tricky; checking the man page for the date command didn't look very promising. It looked like I'd have to do the famous programming exercise of keeping an array of the number of days in each month, checking whether yesterday was still this month or last month, etc. etc.

However, using info date instead of man date gave a lot more information, including this very useful option:

-d DATESTR'
`--date=DATESTR'
Display the date and time specified in DATESTR instead of the
current date and time. DATESTR can be in almost any common
format.

DATESTR can be a word or phrase like "tomorrow" "yesterday", "last week", etc. So my problem was solved in a single line:

svn log -v -r {`date -d "yesterday" +"%Y-%m-%d"`}:{`date +"%Y-%m-%d"`}

Moral of the story - always look at the info page as well as the man page !

Wednesday, November 4, 2009

Forced education #1 - DNS and DHCP with dnsmasq

One of the, ahem, pleasures of working at a startup is that you often have to learn something new in a hurry when something goes wrong. This happened to me the other day when people on our office network suddenly stopped being able to get to anywhere else on the internet or our internal network.

After a bit of troubleshooting, I found out that we still had inbound and outbound connectivity, but DNS had intermittently stopped working - so, since normal people don't carry a long list of IP addresses in their heads, their access to anywhere via its host name was gone.

We had all our office network clients pick up their DNS server via DHCP from our LinkSys AV-082 router. I tried switching the DNS servers defined in the router to OpenDNS in case our ISP's DNS servers were having a problem, but the problem persisted.

Some internet digging and talking with a couple of folks who know a lot more about networking than me led me to the conclusion that the router's DNS and DHCP handling was acting up. Since it still seemed to be working fine as a regular router, I decided the best thing would be to turn off the router's DHCP server and run DNS and DHCP from one of the office servers instead. I set up the people in the office to point directly to OpenDNS to get them going while I was messing around, and got to work.

There's a nice, lightweight Linux package called dnsmasq that will handle both DNS and DHCP. I found it super easy to set up on one of our Fedora servers, thanks to Keith Fieldhouse's article on linux.com; the hardest part was typing in all the MAC addresses for servers that I wanted to have a fixed IP address, since the router's web UI wouldn't let me copy and paste the DHCP MAC to IP address mappings.

The only other tweak I had to make was to configure the network adapter on the dnsmasq machine to have a fixed IP address, rather than trying to get it from DHCP.

After a couple of hours of setup and careful testing, everything was up and running. An extra benefit of having a local DNS server is that it caches all its results, so that lookups to a host that it already knows about are nice and fast. In fact, I've now set up a local dnsmasq server just for DNS at home, since anything that makes web browsing faster has to be a good thing !

Thursday, October 22, 2009

Using your IT monitor for automated testing

An automated IT monitoring system is a must-have for any team these days; few things give me more pleasure (at work) than seeing a web page full of green boxes telling me that all our systems are running smoothly. I like Nagios because it's robust and easy to install / configure / extend, but this tool is showing its age a bit; you might want to look at Zenoss or Zabbix if you're starting from scratch. Nagios' inability to show trend graphs out of the box might be an annoyance - more on that in a future post.

Monitors are great for alerting you when a system goes down or runs out of resources, but I hadn't used them for QA until recently, when I realized that they're also ideal for smoke testing new product builds. If you're working with web applications, this is a piece of cake - all you need to do is:
  • set up a cron or batch job to install your new build on a schedule;
  • have your monitor tool check one or more URLs in your application.
Since monitoring tools can alert you by email or SMS when anything goes wrong, you can get timely feedback if something goes wrong - maybe last night's changes broke the app so that it doesn't even come up any more, or perhaps there's an unexpected change to the content returned by your test URL. If you do your reinstall overnight, the alerts can be waiting in your in box when you start work the next day (Nagios also has a nice Firefox plugin that turns red when there's an alert, in addition to setting off a loud siren that's hard to ignore !)

The monitor runs 24x7, so you also get the built-in bonus of being alerted when somebody inadvertently shuts down your test application; you'd also get warned if the app crashed after running out of resources, although you'd still have to go in and debug the cause in that case.

Here's how a typical test would look in Nagios:

check_command check_http!-p 8080 -u /test/url/ -s "Text Expected"

This uses Nagios' built-in check_http command to go to the URL /test/url on port 8080 and look for a specific string in the HTML output (the host details are specified elsewhere in the Nagios setup).

check_http has lots of other useful options such as checking for a regular expression, sending POST data, controlling the response to a redirected page, checking the age of the returned document or checking the validity of the site's SSL certificate.

check_http does have a couple of limitations:
  • it will only handle basic web server authentication; you can get around this for web apps that use authentication libraries by using the Nagios plugin for WebInject, which will handle web pages with input fields. WebInject also lets you set up multi-step tests that navigate to more than one page; you can write some fairly sophisticated tests this way without having to resort to a full-blown web testing tool.
  • because check_http does a simple HTTP GET, it won't return any page content that's rendered in the browser; this limits what you can check for if your pages include a lot of JavaScript. If you need to test pages with a lot of JavaScript, you'll need to use a more comprehensive Web testing tool like Selenium that can emulate a browser. In this case I'd recommend integrating the tests with your continuous build system rather than the IT monitor, although tools like Nagios have a simple plug-in architecture that lets you integrate additional tools fairly easily.
Take a look at this approach if you need to get some basic testing in place and are strapped for time, people and / or money - all the tools mentioned above are open source.

Wednesday, October 21, 2009

How I got here

I've had quite a varied career in high tech, starting off as a developer and doing spells in QA, customer management and project management (some of the transitions involved bouncing from the UK to the US twice, but that's another blog post).

For the last few years I've settled into technical operations, which I'd essentially define as all the things that keep an engineering team running smoothly. The job can cover a lot of ground: testing, customer support, project management, IT and, of course, the people management work involved in keeping all those things running. Recently I've been working with small startups, so I get to do a lot of hands-on work as well as steering the ship.

Tech ops is a big problem space with a lot of competing best practices (and I kind of like it that way), but I've found that there are a lot of commonalities, too; more on that in future posts.

I'm looking forward to sharing some of the knowledge I've picked up along the way and, hopefully, learning more from you all !